Web development tools and plugins to help you debug

The Doom Cheat code for god mode
Turok: Dinosaur Hunter
There is a famous cheat from way back in February of 1997 from a little game (or well known game that has been lacking as of late) called Turok. This first interactive foray into the world of Turok the Dinosaur Hunter included tons of silly cheats that player could use – that is, hopefully after they had beat the game first.

Turok: Dinosaur Hunter box-art
One secret code, a variation of the well known “God Mode” cheat, allowed players to get infinite ammunition, invincibility, all weapons, big head mode, disco dancing dinos, level skip, and boss skip … all in one nice shiny package.
This code, called the “Ultimate Cheat”, was simply NTHGTHDGDCRTDTRK, which, like all of the other Turok cheats, was a code within itself, as the letters represent a phrase that had all the vowels removed. Can you guess what it said?
Simple – On the eighth day, God created Turok.

Guns? Who needs guns?
This “Ultimate Cheat” is similar to all of the other “God Mode” cheats out there. Tons of games today, especially First-Person Shooters or Action-Adventure games, allow the player to access “God Mode” via the cheats section or through a sequence of button presses.
Where did God Mode come from?
According to the Wikipedia entry about video game cheating, “Cheating in video games has existed for almost their entire history. The first cheat codes were put in place for play testing purposes. Play-testers had to rigorously test the mechanics of a game and introduced cheat codes to make this process easier.”
Furthermore, God Mode itself was originally meant to provide a developer, tester, or programmer the ability to play through a game as if they were God in that universe. This would allow them, much like our Native American Dino Hunter, to have all guns, invincibility, infinite ammo, level skip etc. at the tip of their fingers.
Why you ask? Well if one is truly going to ensure that they have all the bases covered as far as features, bugs, functionality and everything else that goes along with development, they need to go through their self-created universe as if they were … God.
Why can’t Web Developers have God Mode?
They certainly can! There are countless tools, plugins, and useful browser settings just waiting to be used – the problem is most people may not be aware of them! Let’s start with the subjective best choice to quickly bug fix, optimize, and test any web page or application… good ole’ Mozilla Firefox.
Firefox is best known as the first successful browser to take a large stake of the browser market from Microsoft’s Internet Explorer. For a lot of web sites, Firefox has surpassed Internet Explorer as the preferred browser of the masses. One of the nicest features of Firefox is the overwhelming abundance of plugins and add-ons. Plugins can help take an untested site above and beyond the normal level of polish that any developer could deliver in a shorter amount of time than without.

Firefox can easily be the catch-all workhorse that you need
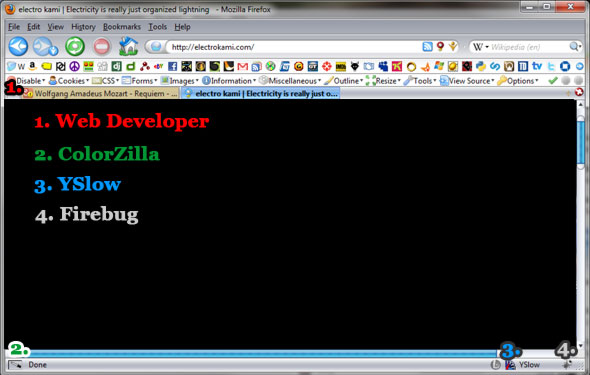
For starters, you should pickup Web Developer. Using this add-on, you can easily disable JavaScript, images, CSS files, as well as produce outlines around different type of elements, highlight anything from an anchor to all titles or even div order (when that one div just doesn’t seem to play nicely). This tool can turn a hellish page produced by the CSS/HTML goon who worked on this page into something much more manageable. Bonus points for the ruler and the resize panel – ever needed to see exactly how large a gap is on a page or wanted to quickly and accurately resize the viewport to an exact resolution. Now you can do it quicker!
Two other key things to note that Web Developer offers are the tools menu and the validation. If you ever wanted to quickly sort out a CSS error or JavaScript error, then the in-page validator that shows up in the top right corner is your best friend. You can find all sorts of typos, errors, bugs, and problems within your CSS, HTML, or JavaScript with ease.
On top of that, if you find that the quick validator is not good enough, then you can use the tool drop down and simply press “Validate HTML” which will automatically send your page over to the World Wide Web Consortium (W3C.org) validator to get more in-depth error message descriptions and help.
Web Developer will help turn any clunky page into a well-oiled machine.
The next thing to pickup for Firefox that will make your life easier is Firebug. Any web developer or designer knows that testing speeds, finding the file transfer rates, debugging JavaScript, or finding missing files can sometimes be frustrating. Firebug’s best tool is it’s “Net” option, which breakdown each file download into an easy to read chart that displays status, domain or origin, the size, and a timeline of the total transfer. This tool can be very helpful when a Flash file doesn’t seem to load that one image (which you find out is named incorrectly).
Along with Firebug, everyone needs the Yahoo created plugin YSlow to find out why their page loads are so slow. After all, how many times have you thought to yourself: “Why is this page so slow?” – with YSlow you can find out with the easily understandable categories (with grades) and also get great tips, ideas, and solutions for each and every problem.
Finally, you should consider getting ColorZilla, simply because it streamlines the process of finding that hex code color (and RGB!) of any element that you can mouse over in Firefox. Why wouldn’t you want this?
Firefox – Okay, What About the Other Browsers?

Safari - now for web developers!
Apple Safari offers a fairly substantial suite of tools built-in to aid in the debugging of any page. By turning on the Develop Menu in the Advanced tab under preferences, you can have access to the error console (which shares a ton of features used in Firebug like the timeline, script debugging, and the element viewer, as well as the ability to disable images, cache, JavasScript, and CSS) making a great extra for any user that loves Safari. Plus you get to access the activity monitor, which can help you find problems with filenames, locations, or scripts.
On top of that, Safari will even aid in switching your User Agent sent by your browser, thereby allowing you to test your special cases for devices like the iPad, iPhone, or iPod Touch. Next time you have a clever PHP or JavaScript function that doesn’t play nicely with these devices, you can prevent it from even happening!
Microsoft Internet Explorer 8 is now also a great solution for easing web debugging. It can even rival some of the features provided by Firefox with all the aforementioned plugins. First there is a lot of much loved repeats that are offered by the Firefox add-on Web Developer, including the ability to disable JavaScript, images, CSS files, and producing outlines around different type of elements. It even has a menu with options to validate your HTML and CSS – sounds great huh?
Looking deeper, you will find a robust profiler similar to what you will find in Firebug or the Safari Develop Menu, as well as the added ability to switch into IE7 mode with IE8 – which isn’t 100% great since the browser does not exactly portray what an Internet Explorer 7 user will see. Yes to reiterate: IE8 in compatibility mode/IE7 mode it not equal to IE7. You are better off using a standalone Internet Explorer 7 to test your sites.
Who knows? Maybe Internet Explorer 9 will have a better method to test for lower IE versions. Or maybe IE9 won’t.
Google Chrome is also a great choice for debugging as it offers somewhat “snappier” speeds and has a host of add-ons (including some of the Firefox ones listed above). Since it is based on Web Kit just like Safari, it can be usually be reliable in terms of seeing the correct CSS display. Using Chrome is a definite must for JavaScript as it produces one of the best results (along with Firefox and it’s brother Safari).
Flash Debugger
There’s nothing like getting a beautifully crafted Flash app up and running and then having it fail once you bring it onto a web server, with no apparent cause for error. If only you could see the error messages! Well there’s a great way to do that without having to write some kind of over-the-top JavaScript output script. All you have to do is download and install the official Adobe Flash Debugger and your troubles will be over before you know it! Maybe you could consider installing it in your favorite browser work-horse Firefox!
Once you have it up and running, you can see exactly what the problem is with your Flash file. Perhaps you left out a certain asset file, or maybe you embedding options are blocking certain features like full screen. Face it – when you build things with Flash, you need to make sure they work, or else no one will come back for a second dip!
